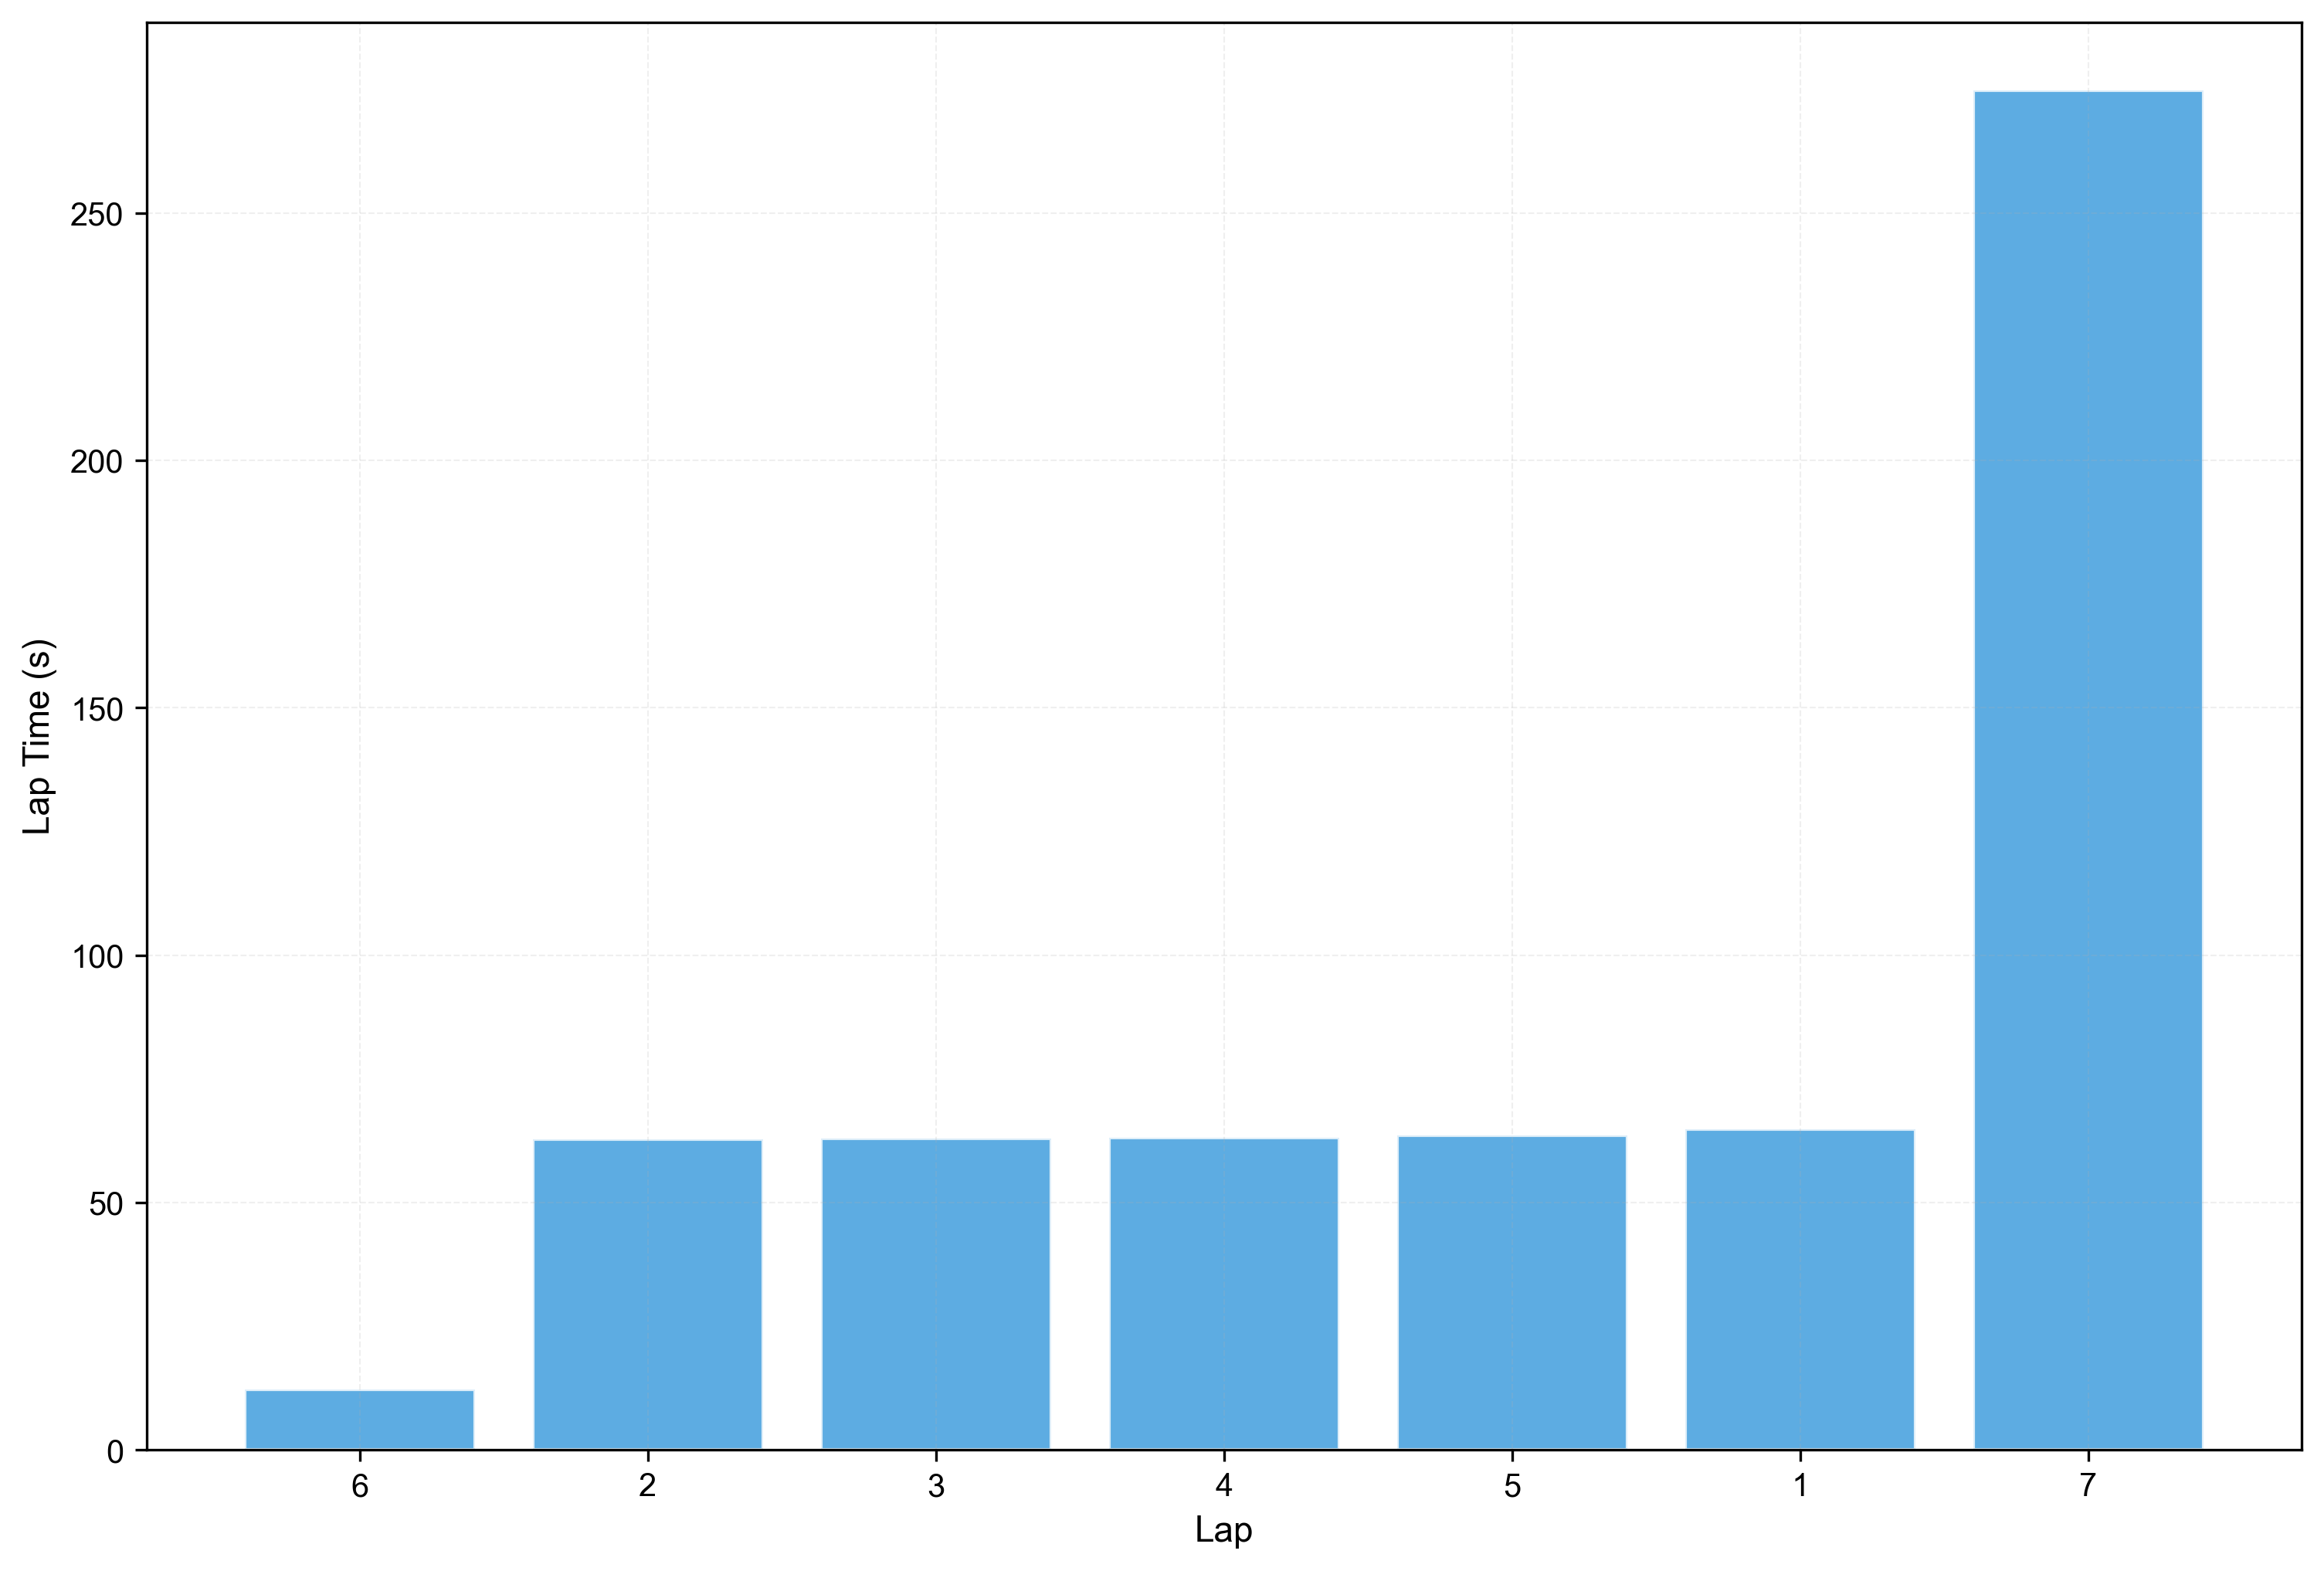
BarChartAnalyzer - Circuit Session - Lime Rock MX-5
Bar chart for comparing lap times, sector times, or other metrics across laps
Sample Data
| Attribute | Value |
|---|---|
| Source | garage61 |
| Category | circuit_lap |
| File | 01K451BYJ64G0T2GPQ44AKXC86 |
Available Channels (23): LongAccel, VertAccel, YawRate, abs_active, brake, clutch, distance, drs_active, gear, lap_distance_pct, lat_accel, latitude, longitude, position_type, rpm, speed, steering, throttle, time, track_pct, x, y, yaw
Configuration
| Setting | Value |
|---|---|
| Metadata Only | False |
When to Use
- User wants to compare lap times visually
- User asks for a bar chart of sector times
- User needs categorical data visualization
Key Options
| Option | Description |
|---|---|
x_column | Category column (default: lap_number) |
y_column | Value column (default: lap_time) |
Sample Output
Subjects Analyzed: 1
Default
| Property | Value |
|---|---|
| Format | png |
| DPI | 300 |
| Subjects | 1 |
Example Calls
Show a bar chart of my lap times
analyze(analyzers='bar_chart', event='01H8SP4HK4')
Creates bar chart with lap_number on x-axis and lap_time on y-axis
Create a bar chart comparing sector 1 times
analyze(analyzers='bar_chart', event='01H8SP4HK4', y_column='sector_1_time')
Bar chart showing sector 1 times for each lap
Generated from b4racing.analysis.graphics.bar.BarChartAnalyzer